Microsoft PowerPoint provides built-in tools for creating and arranging different types of flowcharts. Here’s how they work.
Making a Flowchart in PowerPoint
Since you’re going to be working with shapes, you might find it helpful to have PowerPoint show a grid you can use to size and line up objects.
To show the grid, check the box next to “Gridlines” in the “Show” section of the “View” tab.

Gridlines will now appear on your slides.

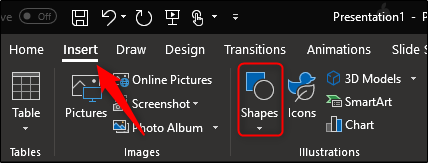
Next, select “Shapes” in the “Illustrations” section of the “Insert” tab.


Post a Comment Blogger Facebook
We welcome comments that add value to the discussion. We attempt to block comments that use offensive language or appear to be spam, and our editors frequently review the comments to ensure they are appropriate. As the comments are written and submitted by visitors of The Sheen Blog, they in no way represent the opinion of The Sheen Blog. Let's work together to keep the conversation civil.