

Sometimes, you want to add data from a Google Sheet into a Google Doc or Slide. Although you can’t directly insert cells and rows from Sheets, you can create a table, chart, or slide, and then insert that into your Doc or Slide.
Note: We will be using Google Docs in these examples but inserting a chart into Slides works virtually the same way.
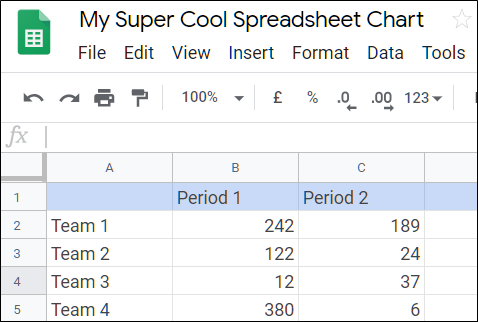
First, you’ll need to generate a chart in your Google Sheets spreadsheet. You can do this by firing up your Google Sheets homepage and opening a new or existing spreadsheet.
After inputting some data and storing it in a spreadsheet, select all the cells and click Insert > Chart. Choose a chart type, make any adjustments, and do any final customizations, then close Sheets–don’t worry, Google saves after every step. We’ve got an article about generating charts in Sheets if you want to learn more.
After you’ve created a chart in Google Sheets, fire up Google Docs and open a new or existing document to insert your chart. Click “Insert,” point to “Chart,” and then click on “From Sheets.”

From the list of available spreadsheets, select the one you want to use and then click “Select.”
Post a Comment Blogger Facebook
We welcome comments that add value to the discussion. We attempt to block comments that use offensive language or appear to be spam, and our editors frequently review the comments to ensure they are appropriate. As the comments are written and submitted by visitors of The Sheen Blog, they in no way represent the opinion of The Sheen Blog. Let's work together to keep the conversation civil.