

Charts are great for visualizing data. Adding animation to charts can make that visualization even better, letting you do things like introduce one piece of a pie chart at a time, so you have more room for discussion. Here’s how to do just that in Microsoft PowerPoint.
Animating a Pie Chart in PowerPoint
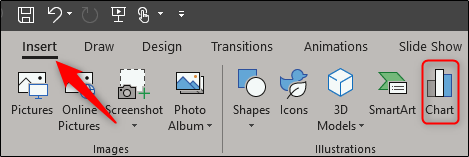
First, open up your PowerPoint presentation and go to the slide where you want the animated pie chart. To insert a pie chart, switch to the “Insert” tab and click the “Chart” button.
In the Insert Chart window that appears, select “Pie” from the list on the left. On the right, select the pie chart style you’d like to use from the five options that appear. When you’ve made your selection, click “OK” at the bottom right of the window.

You’ll notice the pie chart has now appeared on the slide and, with it, and Excel chart. Change the labels of the pie chart by editing the text in column A, and enter its respective data in column B. Once done, close the spreadsheet.

Next, select the pie chart and head over to the “Animations” tab. Here, select whichever animation you’d like to use from the available options. In this example, we will use “Wipe.”
Post a Comment Blogger Facebook
We welcome comments that add value to the discussion. We attempt to block comments that use offensive language or appear to be spam, and our editors frequently review the comments to ensure they are appropriate. As the comments are written and submitted by visitors of The Sheen Blog, they in no way represent the opinion of The Sheen Blog. Let's work together to keep the conversation civil.